What is Diagnostic Imaging?
Diagnostic imaging plays an important role in diagnosis of diseases of the central nervous system (CNS). It is even more important in assessing the effects of Hyperbaric Oxygen Therapy (HBOT) on hypoxic/ischemic lesions of the brain. Various techniques that are relevant to HBOT include:
- Single Photon Emission Computerized Tomography (SPECT Scan),
- Positron Emission Tomography (PET Scan),
- Functional Magnetic Resonance Imaging (MRI),
- Magnetic Resonance Spectroscopy MR spectroscopy, or (MRS)
For practical purposes, SPECT using hexamethylpropyleneamine (HMPAO) or ethyl cysteinate dimer (ECD) is the most practical and widely used diagnostic procedure in combination with Hyperbaric Oxygen Therapy. This technique is illustrated in this appendix.
What is a SPECT Scan?
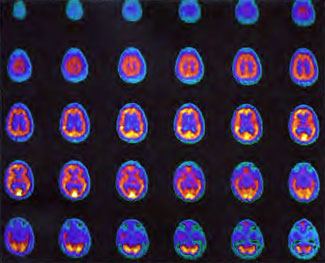
In the past 15 years single photon emission computerized tomography (SPECT) has matured with the development of hexamethylpropyleneamine oxime (HMPAO), ethyl cysteinate dimer (ECD), and receptor specific agents (Maziere 1993). The resolution on triple-head SPECT systems is now 6-9 mm (Holman & Devous 1992) and counting statistics are excellent, but semiquantitative, i.e., HMPAO SPECT and ECD SPECT underestimate high flow (Heiss 1990 and Ishizu 1996, respectively) and HMPAO SPECT overestimates low flow (Heiss 1990) compared to PET.
Ready availability, expanding applications, long shelf life of the agents, computer-assisted evaluation methods, and the known coupling of brain blood flow and metabolism in traumatic brain injury (Meyer et al 1968, Kuhl et al 1980, Obrist et al 1984) have popularized SPECT in recent years, but its unique advantage resides in its ability to image the uncooperative patient, e.g., pediatric, combative, or demented patients. Since the radiopharmaceuticals are fixed in brain on first pass and are independent of subsequent brain activity, thus giving a freeze-frame snapshot of brain blood flow at the time of injection that can be imaged later, an uncooperative patient can be sedated after tracer injection and not alter the picture of brain blood flow acquired later.
What is a PET Scan?
Positron emission tomography (PET) is the current gold standard for measurement of cerebral blood flow, metabolism, and receptor activity. The PET scan exploits the annihilation geometry of positrons that results in the emission of two high energy gamma rays at 180 degree angles (Gilman 1998). The PET scan is technically much more demanding than a SPECT scan and because of high costs, limited availability, and the requirement of a nearby or on-site cyclotron to produce ultra-short half-life radiopharmaceuticals it remains a research and clinical tool at university centers.
The number of additional functional imaging modalities has steadily increased in the past 10 years. The armamentarium now includes:
- Functional Magnetic Resonance Imaging (fMRI)
- MR spectroscopy (MRS) – (Potchen 1991)
- Diffusion Weighted MRI (DWI) with or without perfusion MRI
- Xenon enhanced CT, and CT perfusion
For an excellent review of these in stroke please see (Latchaw et al 2003). To our knowledge most have not been employed in sequence with one or more HBOT treatments.
The most important application of functional imaging to hyperbaric oxygen (Hyperbaric Oxygen Therapy) has been the attempt to capture the effect of a single or multiple HBOT treatments on brain blood flow, metabolism, or function. The first attempt employed Electroencephalography (EEG) (Holbach 1977f) while all subsequent investigations have used SPECT in an effort to visualize idling neurons (Neubauer 1990) or recoverable brain tissue in a functional ischemic penumbra (Neubauer et al 1989b, 1992c, 1995a, 1998, 2001, Harch 1992, 1994b, 1996, Golden et al 2002, Miura et al 2002 ).
Medical Imaging Diagnostic System Techniques
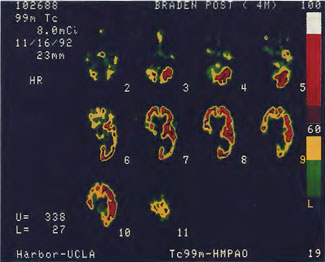
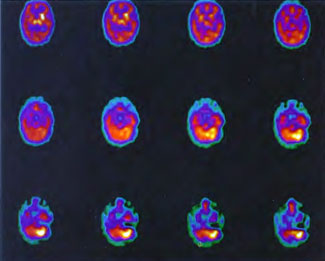
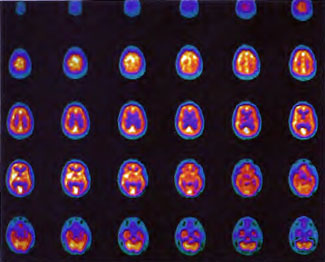
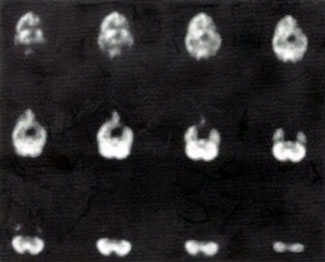
The basic technique involves SPECT imaging with Iodoamphetamine (IMP), HMPAO, or ECD before and after Hyperbaric Oxygen Therapy treatment in full or split-dose fashion. The full dose technique is a two day procedure with baseline SPECT imaging the first day, a single HBOT treatment later that day or the following day, and repeat SPECT imaging at least 24 h (four half-lives of technetium, the SPECT tracer) after the first SPECT, and ideally 2 or more hours after HBOT treatment. The split-dose technique is a one day procedure that uses a single full SPECT dose of radiotracer divided in weighted or equal parts with imaging before and shortly after a single HBOT treatment. Because of the requirement for special subtraction software (Hashikawa 1994) to eliminate the confounding visual effects of the two superimposed split doses the split-dose method has been infrequently used in the clinical setting.
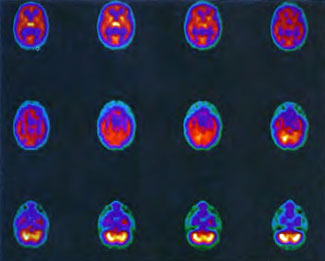
Regardless of full or split-dose, the generally observed response has been a global increase in flow and a redistribution of flow from higher to lower flow areas to give a visual appearance of smoothing or homogeneity. The effect appears to be non-specific since it has been documented in a variety of neuropathologies (vide supra), but may be dependent on timing of the SPECT injection after the HBOT exposure.
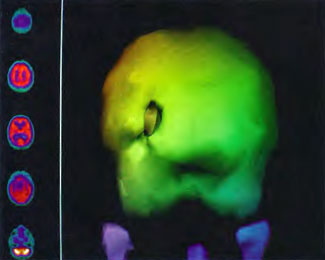
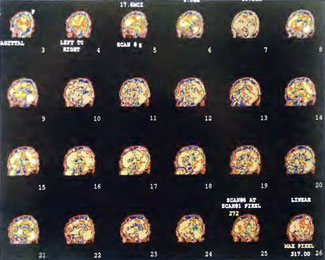
In the first years of investigation of this technique a few select patients were injected with SPECT tracer within a few minutes of exit from 1.5 ATA hyperbaric treatments while on room air (Figure 40.1B) or supplemental high flow oxygen (Figures 40.2C & 40.2D) to see if the effect first described by Neubauer et al (1990) was a direct or indirect effect of oxygen.
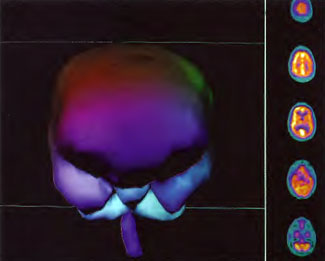
It appeared from these and a multitude of other cases that the effect was an indirect action of Hyperbaric Oxygen Therapy treatment and that if patients were injected too soon after chamber exit (Figure 40.1B) or while on supplemental oxygen (Figures 40.2C and 40.2D) after chamber exit hyperoxic vasoconstriction was disproportionately recorded; this hyperoxic vasoconstrictive effect on normal brain is even more pronounced in normal individuals (Figures 40.3C and 40.3D). The exact explanation of the delayed improved brain blood flow to ischemic regions following a 1.5 ATA HBOT treatment is unclear, but acutely may be due to reverse steal from higher flow more normal vascular beds to ischemic beds as the higher flow beds vasoconstrict in response to hyperoxia (Figures 40.2C & 40.2D), increased perfusion to passive damaged cerebral vascular beds as a result of increased peripheral vascular resistance and widened pulse pressure, increased flow demanded by HBOT stimulated increased metabolism in the ischemic territory, or some other explanation. However, as the time period after HBOT treatment lengthens and hyperoxic vasoconstriction wanes the Neubauer Effect is best explained by the latter mechanism (Figures 40.4A and 40.4B).
This phenomenon was rigorously evaluated in patients with chronic brain contusions and normal subjects by one of the authors (Paul G. Harch M.D. ) and colleagues with statistical parametric mapping analysis of SPECT (Barrett et al 1998). Improvement in SPECT was shown in patients with brain contusions but not the normal subjects.
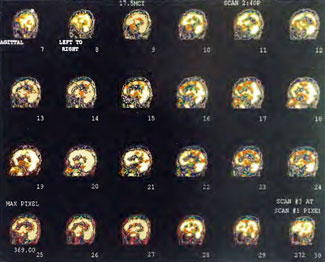
This SPECT technique to visualize the ischemic penumbra and the capacity of injured “brain to respond to repetitive Hyperbaric Oxygen Therapy treatment is still in its infancy. Specifically, the sensitivity and specificity, exact timing of SPECT post HBOT treatment, the question of timing in different neuropathologies, whether the degree of improvement in brain blood flow post-HBOT treatment is predictive of the magnitude of subsequent functional outcome, and the degree of transience/permanence to the effect of a single or multiple HBOT’s are all unknown. Since the publication of the third edition of this text the final question has been partially addressed. The animal studies (Harch et al 1996) both demonstrated persistence of cerebrovascular changes in chronic injured rat brains three to six weeks after the 80th HBOT. Vascularity was decreased in normal brain and increased in damaged brain. The degree of transience and permanence to these changes have been observed in a number of patients treated with HBOT by author Paul G. Harch M.D. over the past years. An example is shown in Patient 1, Figures 41.5 A-1. The series of scans shows an improvement in brain blood flow and pattern to a more normal pattern with each course of HBOT and a partial regression after completion of the second course of HBOT. Concomitantly, the patient improved symptomatically, on physical exam, and after the third course of HBOT, on psychometric testing.
Author Paul G. Harch M.D. has noted this pattern of partial regression post Hyperbaric Oxygen Therapy treatment and improvement after reintroduction of HBOT in a variety of other patients he has followed over the years, particularly those with toxic brain injury. SPECT has recorded changes in blood flow consistent with the patients’ clinical conditions. It appears that blood flow is redirected to damaged areas or metabolism/flow are increased transiently to these areas, consistent with the finding in the animal model (Harch et al 1996) where brain vascularity was decreased in normal brain and increased in damaged brain. This phenomenon implies a manipulation of brain blood flow and metabolism that requires some schedule of ongoing HBOT to maintain the effect. In other words, low-pressure HBOT appears to behave like a simple drug for part of its non-trophic effect consistent with the definition of HBOT given in the introduction to Chapter 18 of the Textbook of Hyperbaric Medicine. Mechanistic answers as well as answers to the other questions posed above will require further research, clinical experience, and application of functional imaging to HBOT.
Acknowledgment
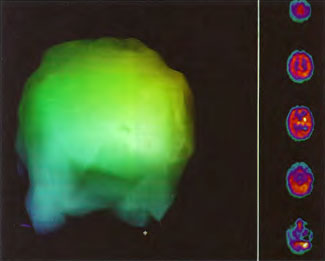
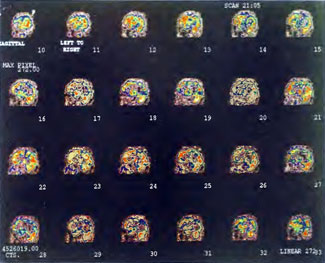
All images in Figures 41.2-41.4 were obtained on a Picker Prism 3000 Triple-head Nuclear Scanner by technologist Phil Tranchina, West Jefferson Medical Center, Marrero, Louisiana. Pictures were taken by author, Paul G. Harch M.D., with a 35 mm camera on tripod. Images in Figures 41.5 A-J originated from an ADAC dual-head camera and were photos of color laser prints taken by a 5.2 mega pixel digital camera on a tripod. Since the transverse images on laser print were not available for all of the scans the sagittal orientation was chosen for most of these figures. The photos were then adjusted to reduce glare. As a result, some of the scans appear brighter than others with a slightly different background. The color scale for blood flow was not altered, however, and remains the same throughout the sequence of scans.
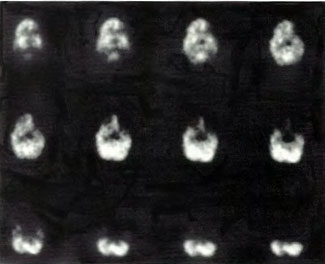
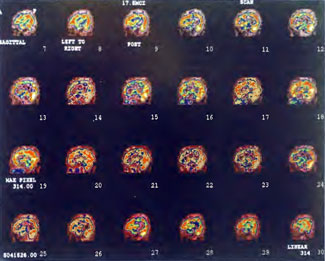
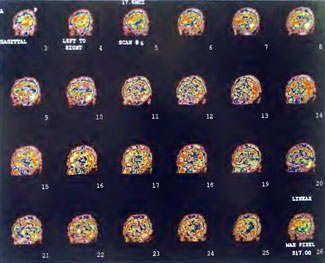
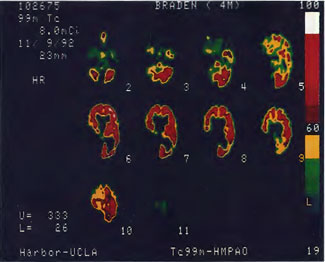
Patient 1: The patient is a 29-year-old white male who experienced carbon monoxide poisoning from a propane powered forklift operating in a 40 x 50 ft. room for 4 h. The patient complained of a moderate headache and mild nausea. He was taken to a nearby emergency room and given surface oxygen for approximately 6 h and was then transferred to a hyperbaric unit where he underwent a single 3.0 ATA multiplace CO table 9 h after extrication. CO level drawn 3 h after extrication while on oxygen was 24.1%. Past medical and social history are significant for one pack/day smoking and significant polypharmacy drug abuse habits; the drug use ended 2 months before the CO exposure. Over the ensuing 3 days the patient developed delayed neuropsychiatric syndrome (DNS) of carbon monoxide poisoning with headaches and a variety of cognitive symptoms. Physical exam revealed mild balance abnormalities and a Folstein Mini-Mental Status score of 26; score was 30 after his first Hyperbaric Oxygen Therapy three days earlier. The patient was imaged with SPECT in Figure 41.5A and underwent a course of HBOT at 1.5 ATA/60 daily twice a day for 40 treatments with steady clinical improvement. Three hours after the second HBOT treatment and 17 h after injection of the first SPECT in Figure 41.5A, SPECT was repeated in Figure 41.5B, showing a more normal pattern of flow, consistent with partial amelioration of his symptoms. Seven days after the conclusion of HBOT SPECT was obtained in Figure 41.5C, demonstrating an improvement in flow and pattern of flow, again consistent with clinical improvement. To highlight the change from baseline the scan in Figure 41.5C is registered on the pixel scale for the scan in Figure 41.5A and presented in Figure 41.5D. The doses of radiopharmaceutical (HMPAO), conditions of injection, time from injection to scanning, and processing are identical for every scan in this case presentation.
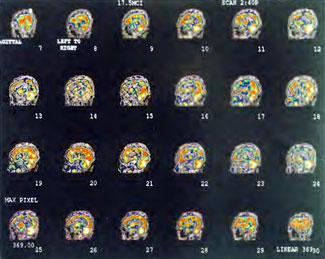
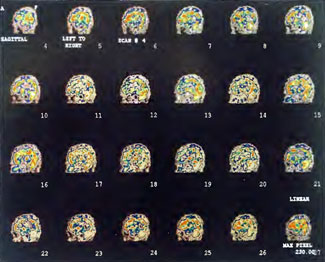
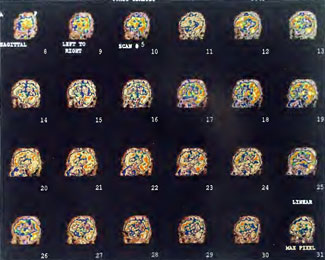
In the subsequent weeks the patient experienced a recurrence of symptoms. Because of complications in obtaining further Hyperbaric Oxygen Therapy the patient was treated pharmacologically with minimal effect on his condition. At the request of the patient and others injured in the mass exposure (23 persons) the author (Paul G. Harch M.D.) began a third course of HBOT at 1.5 ATA/90 daily, beginning 4 months after the final HBOT and SPECT from the second course of treatment. SPECT was repeated in Figure 41.5E before this third course of HBOT and demonstrated a florid deterioration in amount (note maximum pixel count) and pattern of blood flow compared to the last scan after HBOT in Figure 41.5C, but an improvement in pattern compared to the patient’s first scan seen in Figure 41.5A. This scan was consistent with the clinical condition in that the patient was better now than before the second course of Hyperbaric Oxygen Therapy when he was experiencing DNS- but worse than after his peak clinical experience from the second course of HBOT. For easier comparison the scan in Figure 41.5E is registered on the pixel scale of the scan in Figure 41.5A and presented in Figure 41.5F. The patient underwent a single HBOT at 1.5 ATA/90 and SPECT repeated in Figure 41.5G. Note the improvement in pattern with minimal increase in flow (maximum pixel count increased from 230 to 239). The patient proceeded through 34 additional Hyperbaric Oxygen Therapy treatments. At the conclusion of this third round of HBOT he was clinically better and showed an improvement in neuropsychological testing compared to the identical testing 4 months earlier at the initiation of Hyperbaric Oxygen Therapy.
A Repeat SPECT 2 days after the 35th Hyperbaric Oxygen Therapy treatment is featured in Figure 41.5G and again tracks the patient’s clinical condition. SPECT of Figure 41.5G is placed on the same pixel scale as the baseline scan in Figure 41.5A (before the second round of HBOT) and Figure 41.5E (before the third course of HBOT) and presented in Figures 41.5H and 41.5 I, respectively. Throughout this patient’s clinical course the SPECT tracked the clinical condition.